
AI automation

Reports that write themselves, from numbers you can trust

Pulling the monthly figures out of four systems takes a day. Reading them properly takes another. Both are jobs a well-built reporting setup should be doing for you.
  • Free first call
  • Written proposal before any work
  • One person to talk to
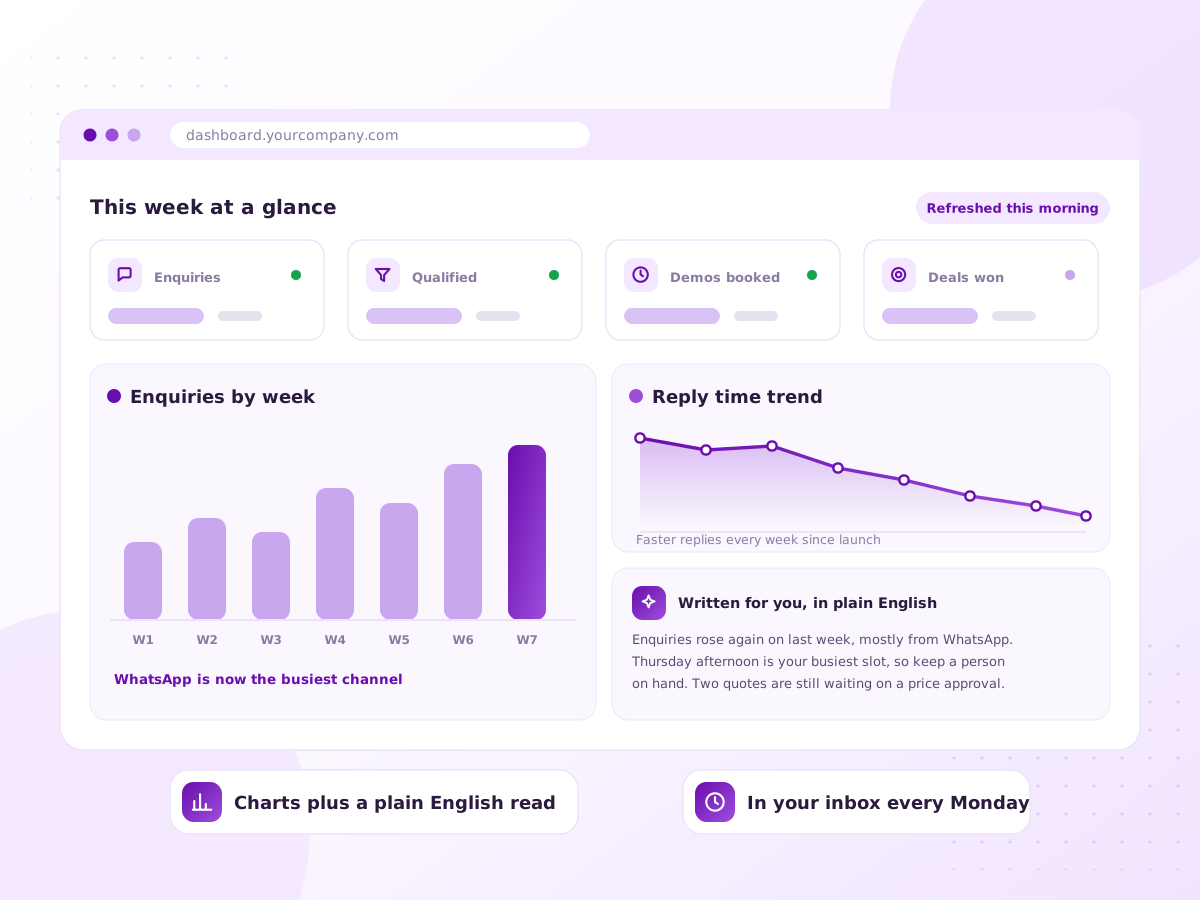
Illustration of a dashboard with charts and an AI written summary of what changed this month

The plumbing comes before the clever bit

Most reporting problems get blamed on a missing dashboard. They are almost always a data problem, so the plumbing comes first.

Sales, finance and operations data is pulled into one place on a schedule, with revenue meaning the same thing on every chart. The AI layer then writes a monthly summary and raises an alert when a number moves.

One caution we give everybody: a model should not invent your numbers. The figures come from queries you can read. The model writes the commentary.

Sound familiar?

When nobody in the room agrees on the number

Ask a simple question in a management meeting and watch what happens. The cause is usually plumbing, not AI.

  • The monthly report takes somebody two days to build
  • Three systems, three versions of one number
  • Dashboards exist but nobody opens them
  • You hear about a problem a month late
  • Getting an answer means asking someone to run a query
  • Decisions use whichever number was easiest to find
What’s included

Foundations first, commentary second

The first three are unglamorous and not optional. The last three are the ones people notice.

Data pulled together

Scheduled extracts from your CRM, accounting, shop and ad systems into one database.

Agreed definitions

One written definition per metric, so revenue means the same thing everywhere.

Dashboards people use

A few clear views built around the decisions you actually make.

Written summaries

A monthly narrative: what changed, by how much, and what seems to be driving it.

Alerts that matter

A notification when a metric moves out of range, sent to someone who can act.

Ask your data a question

A plain-English interface that shows the query it ran, so you can check it.

How it works

Start with the decision, work back to the number

  1. 1

    Agree the questions

    We start with the decisions you make monthly, then work back to the numbers.

  2. 2

    Connect the sources

    Data pulled from each system on a schedule, with the messy parts cleaned.

  3. 3

    Define the metrics

    Written definitions signed off by you. This is what makes everything after it trustworthy.

  4. 4

    Build dashboards and summaries

    Views first, then the automated narrative and the alerts.

  5. 5

    Review and prune

    After a few cycles we drop the charts nobody opens and add what people ask for.

What you get

  • Your data sources connected and refreshing on a schedule
  • A written definition for every metric reported
  • Dashboards for the team and for management
  • Automated weekly or monthly written summaries
  • Alerts when a number moves out of range
  • A question interface that shows its working

Tools and platforms we work with

Looker Studio Metabase Power BI PostgreSQL BigQuery Google Analytics 4 n8n Claude API

We pick tools that suit your budget and team. If you already use something, we work with it.

Who it’s for

Owners tired of waiting for the figures

Multi-branch businesses

Comparing locations without waiting for each manager to report.

E-commerce

Joining ad spend, orders and margin into one honest view.

Manufacturing

Production, sales and stock data sitting in separate systems.

Agencies

Client reporting assembled by hand every month.

Why work with Ratawa Technologies

  • The numbers come from queries you can read, not a model guessing.
  • Metric definitions are agreed in writing before anything is built.
  • We prune the charts nobody opens instead of adding more.
  • Your data, warehouse and dashboards stay in your accounts.

What affects the cost

Priced as a build plus optional monthly support. It depends on:

  • How many systems we connect and how clean they are
  • Number of dashboards and reports
  • Whether a warehouse needs setting up
  • Tool and warehouse subscriptions, paid to the provider

You get a fixed written quote after the first call. No surprise charges.

FAQ

AI Analytics & Reporting: common questions

Not reliably. A model handed a raw spreadsheet produces confident, plausible, sometimes wrong analysis. Defined metrics come first.
Not always. Two or three systems with decent APIs can work with a lighter setup. Volume and history are what tip it.
Yes, and we always show the query behind the answer. A number without its working is not something to decide on.
Usually. Most accounting and ERP systems have an API or a scheduled export. We check your tools during scoping.
You can, and we document it so that is realistic. Most clients keep a small monthly arrangement.
Usually a few weeks. The time goes into agreeing definitions and cleaning data, not drawing charts.

Stop rebuilding the same report

Tell us which report costs you the most time each month. We will show you what it takes to generate it automatically.